1. Introduction
Tableau is a high speed in processing and data visualization, providing more results with less effort. It is the leading provider of fast analytics, data visualization and business intelligence software. It's an award winning application which enables anyone to easily create and share interactive data visualizations, dashboards and analytics, and is scalable to organizations of any size. Tableau has become synonymous with user friendly, flexibility, fast and interactive.
In Tableau:
- Data discovery, analysis and collaboration throughout your organization
- Share data with others in a browser.
- It is faster and easier
- Interactive dashboards on the web
- Combine all the data you need into a powerful dashboard.
- Publish it on the web so you can filter, highlight and drill down right in a browser.
- Embed it right in your team's workspace or send it out via email.
Compatibility across Multiple Platforms
Tableau has revolutionized the business analytics industry by making insight immediately accessible to anyone – whether it's through a desktop tool, web browser, iPad or mobile phone.
Sample Reports:
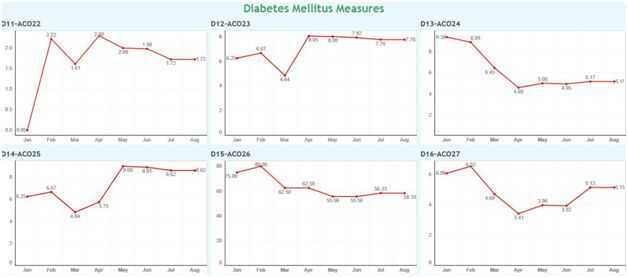
1. A health care provider can see the performance of the Facility in terms of ACO (Accountable Care Organization) measures
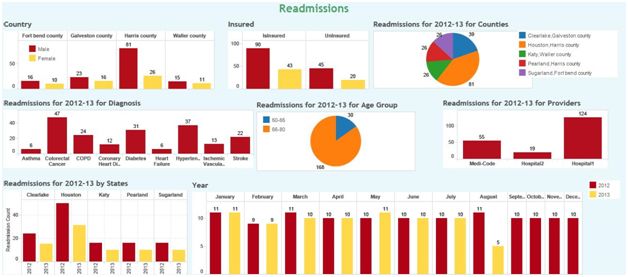
 2. Readmission counts and percentages of a Facility based on different dimensions like Gender, Disease, Age Group, Demographics etc to validate the Facility performance against ACO.
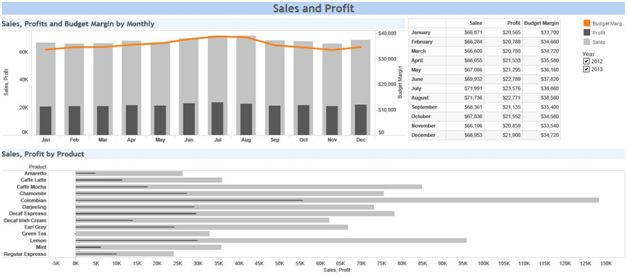
 3. AS an Ecommerce administrator one can review the sales and profits distribution filtered on different dimensions.
This includes two graphs and one list showing sales and profits. Here you can see overlapping the bars (sales, profit) and line (budget margin).
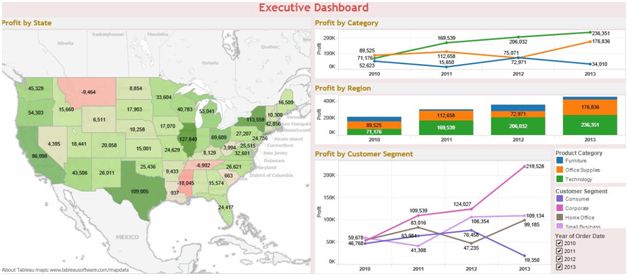
 4. Sales and Profits based on different demographic regions of the Country represented in a map.
This includes four graphs showing sales by different dimensions. Hover cursor over a particular state will provide a detail box. If you click on any state in graph, all the remaining graphs shows the data for that particular state only.